Debugging a Java application running inside a Docker container can be a straightforward process if you follow these simple steps. In this guide, I will walk you through the necessary steps to attach a debugger to your Java application.
Java application
First of all, let’s create a sample Java application to debug. We’ll be using Javalin for creating a simple API.
Project structure
Here is the folder structure for our project:
.
├── Dockerfile
├── pom.xml
├── src/
│   ├── main/
│   │   ├── java/
│   │   │   └── dev/
│   │   │       └── yasint/
│   │   │           └── Main.java
│   │   └── resources
│   └── test/
│       └── java
└── target
Maven configuration (pom.xml)
Create the pom.xml file with the following content:
<?xml version="1.0" encoding="UTF-8"?>
<project xmlns="http://maven.apache.org/POM/4.0.0"
         xmlns:xsi="http://www.w3.org/2001/XMLSchema-instance"
         xsi:schemaLocation="http://maven.apache.org/POM/4.0.0 http://maven.apache.org/xsd/maven-4.0.0.xsd">
    <modelVersion>4.0.0</modelVersion>

    <groupId>dev.yasint</groupId>
    <artifactId>debugger</artifactId>
    <version>1.0-SNAPSHOT</version>
    <packaging>jar</packaging>

    <build>
        <finalName>app</finalName>
    </build>

    <properties>
        <maven.compiler.source>21</maven.compiler.source>
        <maven.compiler.target>21</maven.compiler.target>
        <project.build.sourceEncoding>UTF-8</project.build.sourceEncoding>
    </properties>

    <dependencies>
        <dependency>
            <groupId>io.javalin</groupId>
            <artifactId>javalin</artifactId>
            <version>6.1.3</version>
        </dependency>
        <dependency>
            <groupId>org.slf4j</groupId>
            <artifactId>slf4j-simple</artifactId>
            <version>2.0.10</version>
        </dependency>
    </dependencies>

</project>
Docker configuration (Dockerfile)
Create the Dockerfile with the following content:
FROM eclipse-temurin:21-jre-alpine
COPY target/app.jar /app/app.jar
WORKDIR /app
EXPOSE 7070
CMD ["java", "-jar", "app.jar"]
Application code (Main.java)
Create the main application file Main.java under src/main/java/dev/yasint/:
package dev.yasint;

import io.javalin.Javalin;
import io.javalin.http.Context;

public class Main {

    public static void main(String[] args) {
        Javalin.create()
                .get("/hello", Main::hello)
                .start(7070);
    }

    private static void hello(Context ctx) {
        ctx.result("Hello World!").status(200);
    }

}
Building the application
To build the application, run the following commands:
mvn clean install packageRunning the application in Docker
Now let’s build and run the Docker container with our application. We can use the following commands:
docker build -t app .
docker run -d -p 7070:7070 --name java_app app
Now our application should be running and accessible at http://localhost:7070/hello.
Attaching the debugger
Now the fun part begins! To enable debugging, we need to modify the Docker configuration to include the necessary JVM options.
Debugging configuration
Before configuring our IDEs, we need to adjust how we run our Java application. Specifically, we need to enable the Java Debug Wire Protocol (JDWP). JDWP is the protocol that facilitates communication between a debugger and the Java Virtual Machine (JVM) being debugged (referred to as the target VM)1.
I am using JDK 21 and the following option to enable debugging. You can use the same option if you are using JDK 9 or later.
-agentlib:jdwp=transport=dt_socket,server=y,suspend=n,address=*:5005However, if you’re using a JDK version below 9, the configuration is slightly different. Below, I outline how to configure various versions of the JDK.
// For JDK 5 to 8:
-agentlib:jdwp=transport=dt_socket,server=y,suspend=n,address=5005
// For JDK 1.4.x
-Xdebug -Xrunjdwp:transport=dt_socket,server=y,suspend=n,address=5005
// For 1.3.x and below
-Xnoagent -Djava.compiler=NONE -Xdebug -Xrunjdwp:transport=dt_socket,server=y,suspend=n,address=5005The next step is to modify the Dockerfile’s CMD command to include the debugging configuration:
CMD ["java", "-agentlib:jdwp=transport=dt_socket,server=y,suspend=n,address=*:5005", "-jar", "app.jar"]Running the application with debugging enabled
Rebuild and run the Docker container with the updated configuration:
docker stop java_app && docker rmi app --force
docker build -t app .
docker run -d -p 7070:7070 -p 5005:5005 --name java_app app
Publishing the Debugging Port
It’s crucial to map the debugging port (
5005) to the host machine, especially since we are running inside a container. This allows the debugger on the host machine to communicate with the JVM inside the container, enabling efficient debugging.
Configuring your IDE
Now we can set up our IDE to connect to the remote JVM for debugging.
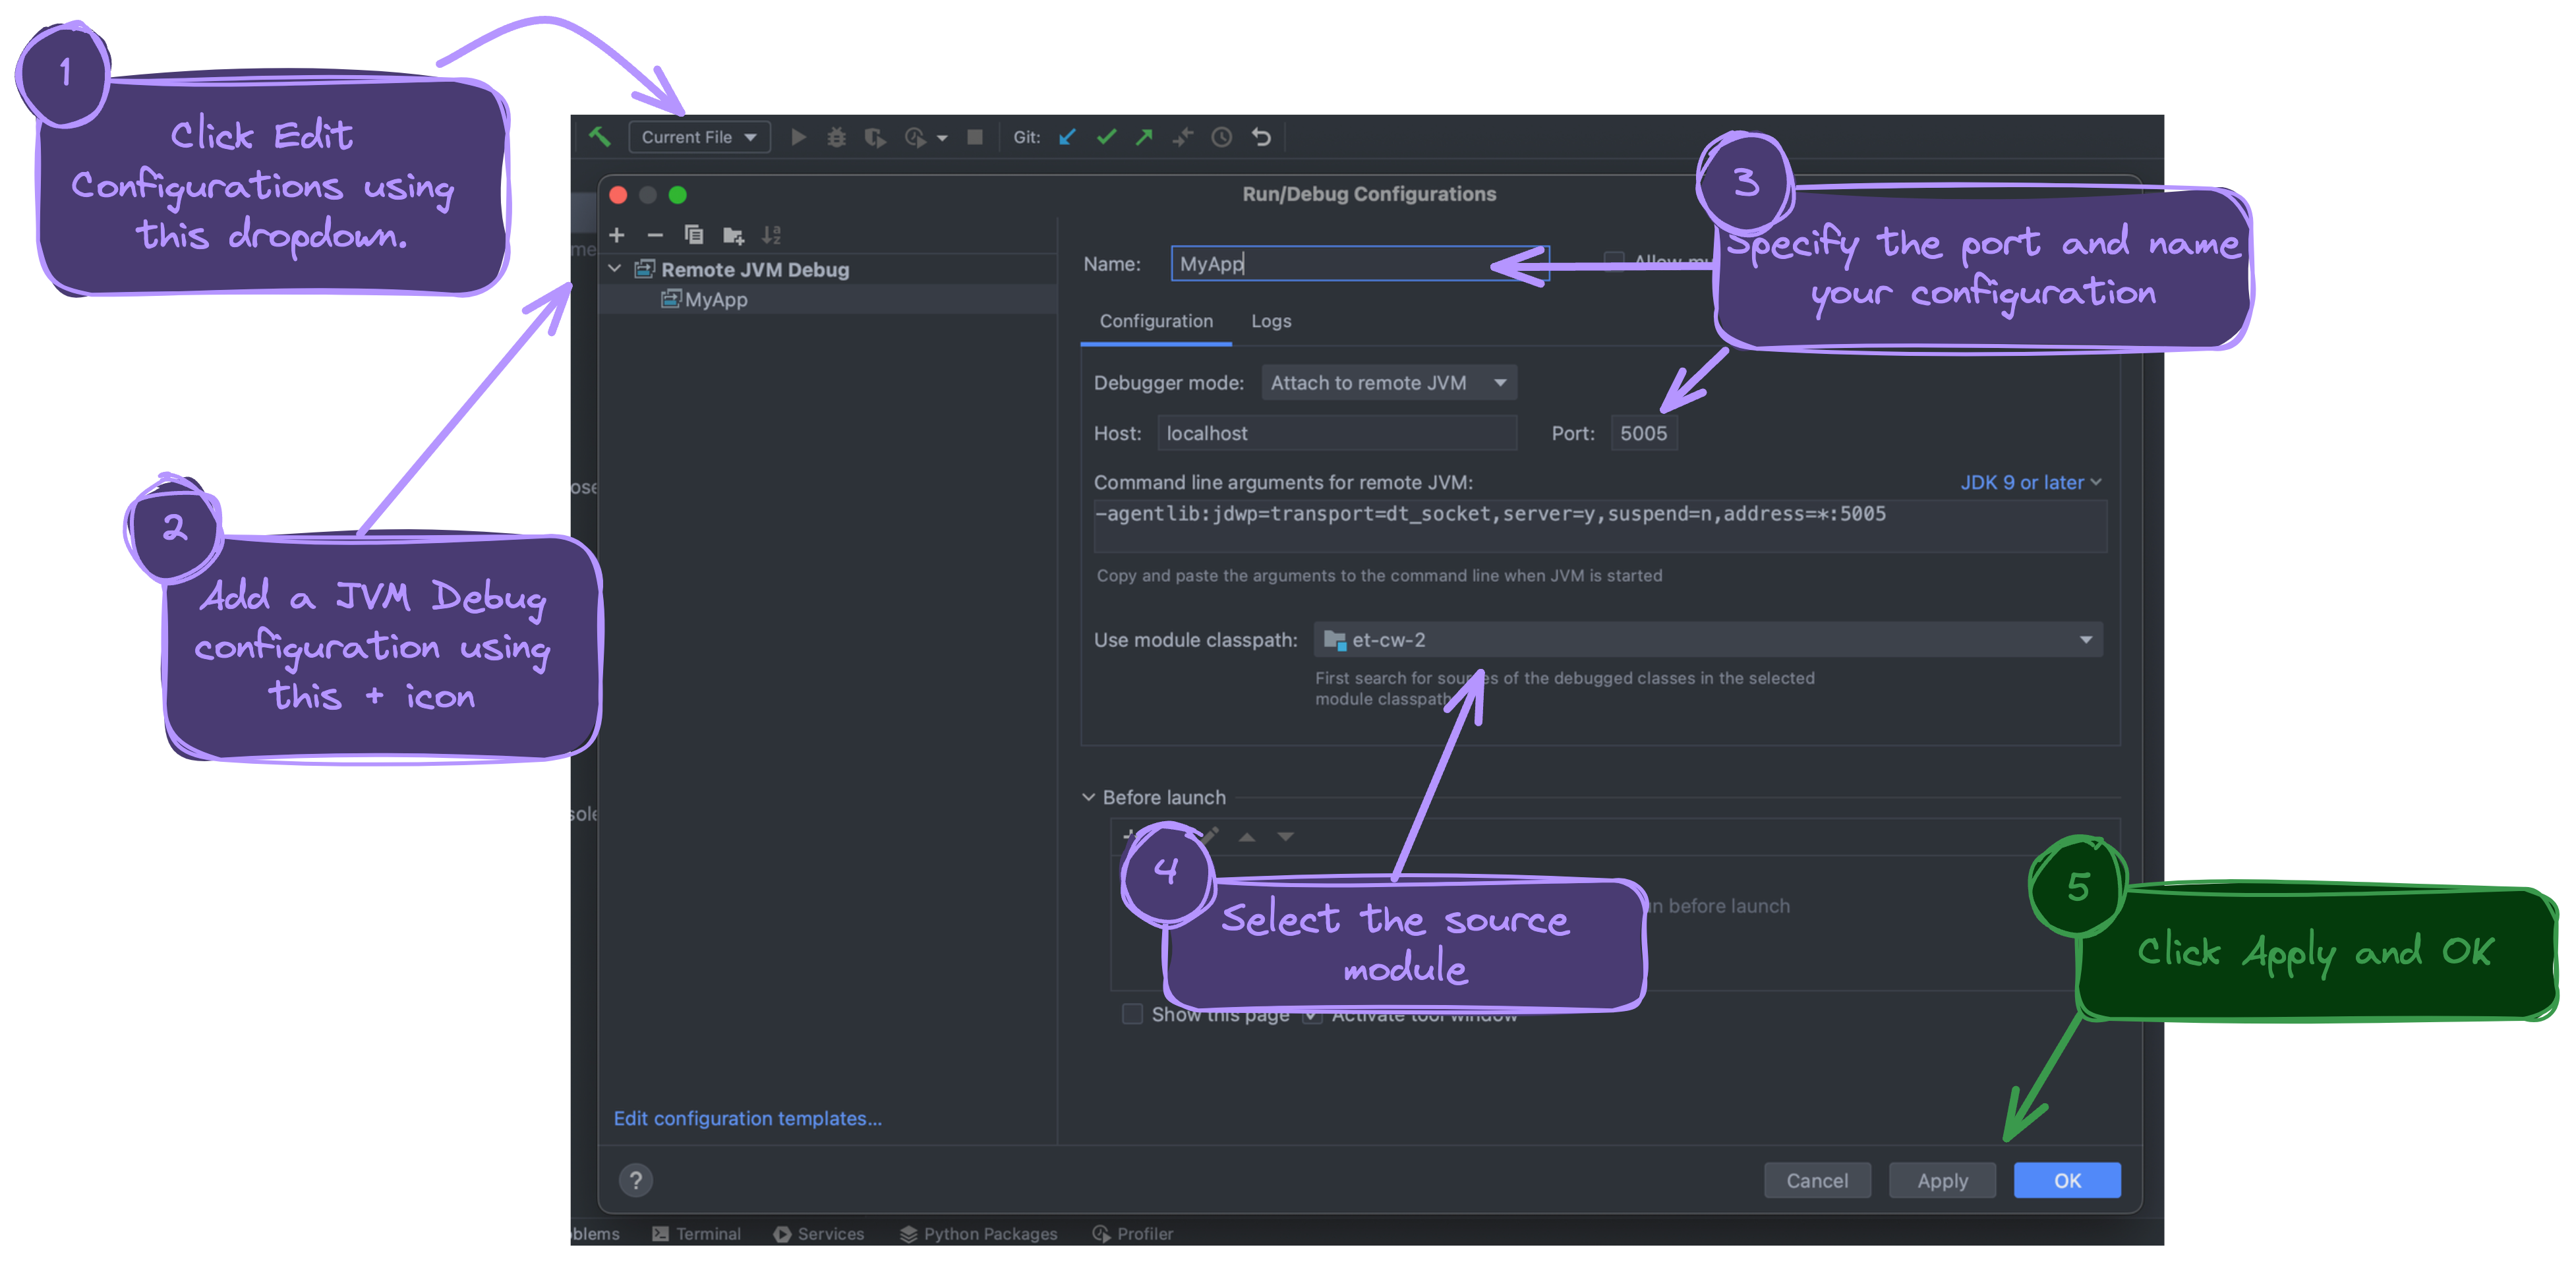
For IntelliJ IDEA:
- Go to
Run>EditConfigurations. - Click the
+icon and selectRemote JVM Debug. - Configure the remote debugger with the following settings:
- Name:
MyApp(literally anything you want) - Host:
localhost - Port:
5005
- Name:
- Apply the changes and click
OK.
For Eclipse:
I don’t have a detailed explanation for configuring Eclipse, but the steps are quite similar to what I’ve described above. For a reasonably up-to-date guide, I found this helpful article from Eclipse.org: Eclipse Debug Configuration.
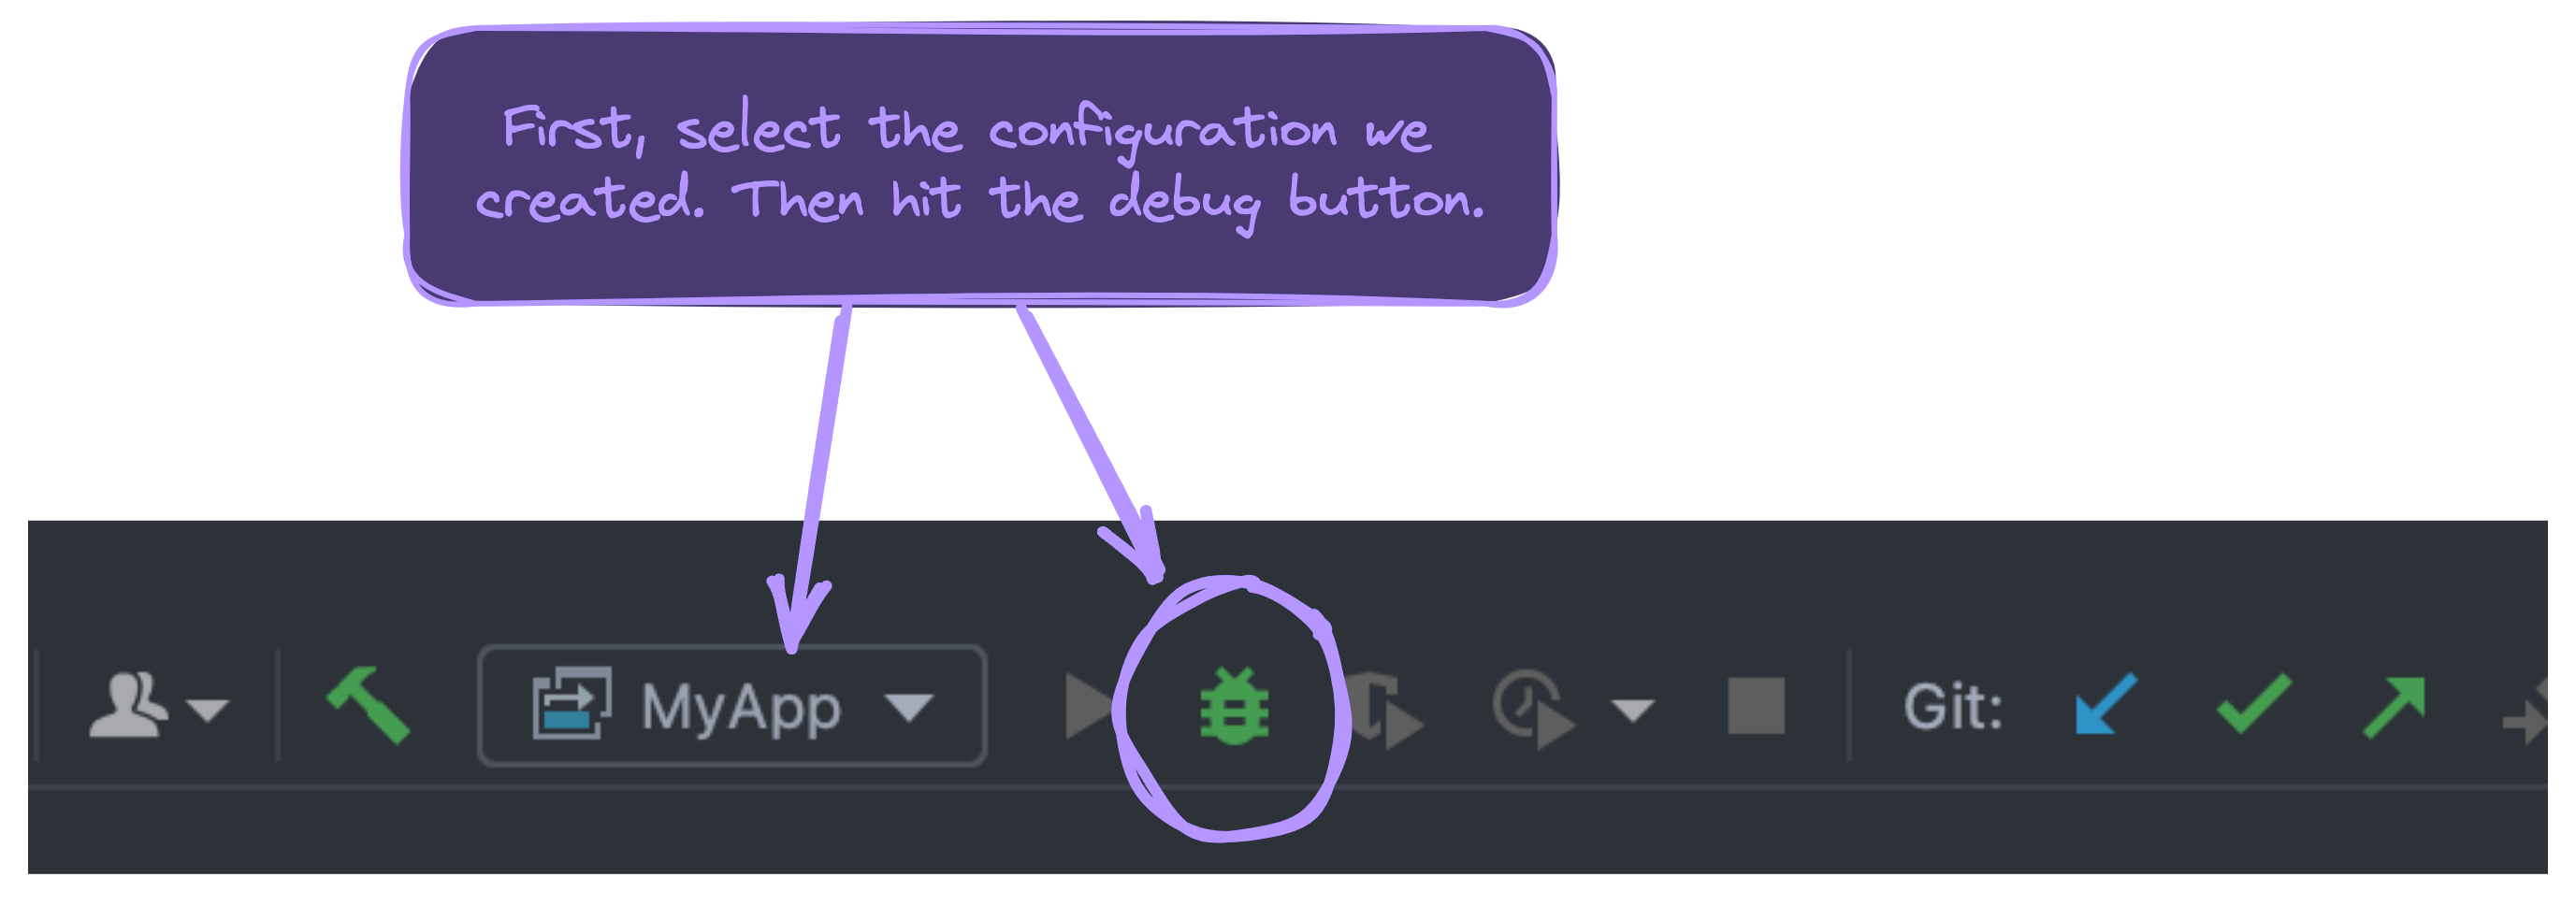
Starting the debugging session 🐞
Start the remote debugging session from your IDE. You should now be connected to the JVM running inside your Docker container. You can set breakpoints, inspect variables, and step through your code as if it were running locally.
Conclusion
By following these steps, we have successfully created a simple Java application with Javalin, packaged it into a Docker container, and attached a debugger to it. This setup allows for effective debugging, enabling you to troubleshoot and optimize your application efficiently.
Footnotes
-
Note that JDWP is optional and may not be available in all JDK implementations. Its presence allows for the use of the same debugger across different JVMs ↩